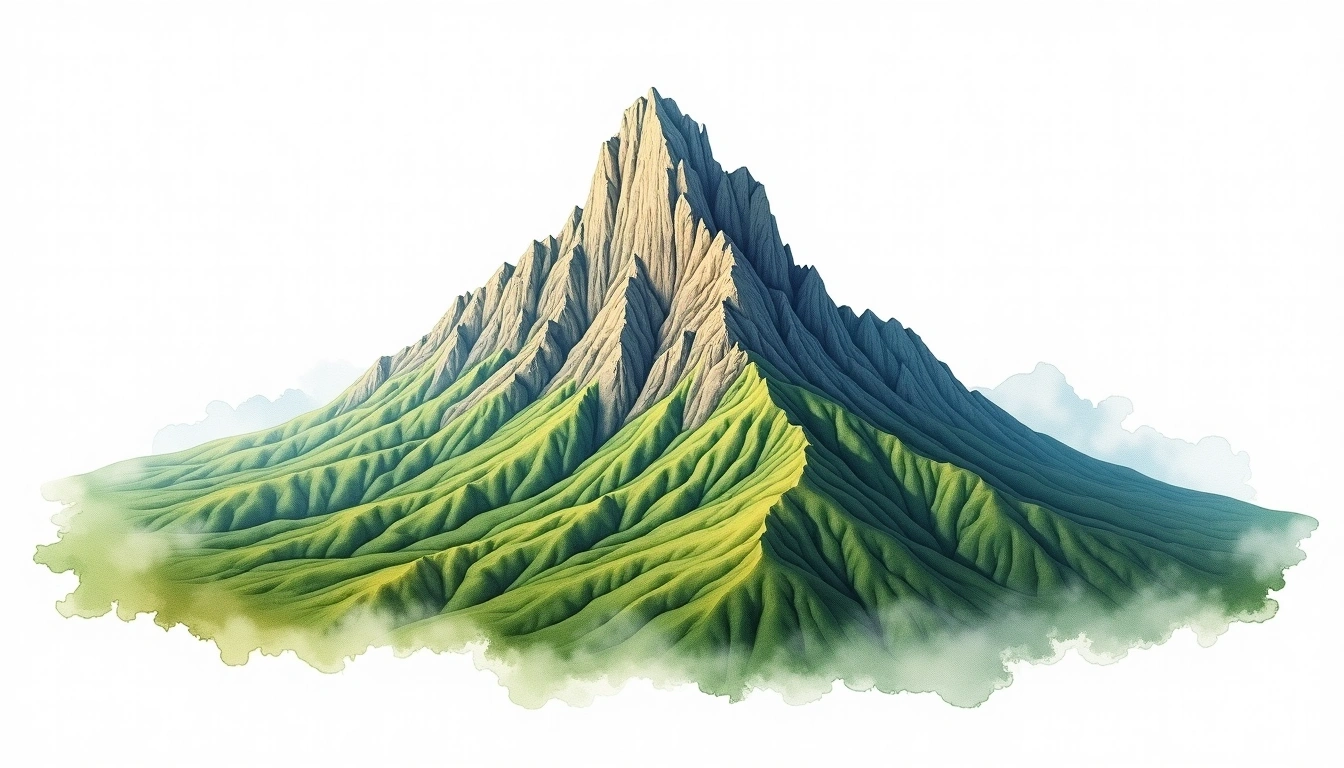
Pico da Neblina, Brazil'da 2994 metre yüksekliğe sahiptir, South America.
Bu zirve Fold Mountain olarak sınıflandırılır.
Yükselti
2994 m
Belirginlik
— m
Koordinatlar
0,801944, -65,983056
Tür
fold_mountain
On this page
Yükselti Karşılaştırması
Bu dağ hakkında
Pico da Neblina (2994m) is a fold mountain in Brazil. Grade 4/5: technical ascent requiring mountaineering skills. A well-regarded peak in its region, offering accessible terrain and panoramic views for fit hikers.
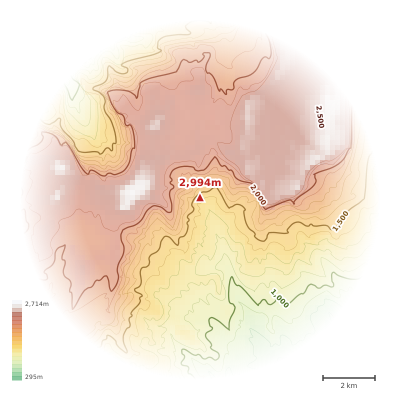
The topographic contour map of Pico da Neblina (2994m) shows elongated parallel contours following the ridge axis. Contour lines are drawn at 50m intervals, with index contours (thicker lines) every 250m. The hypsometric color scale ranges from green (lower elevations) through yellow and orange to white (highest elevations near the 2,994m summit).
Yükseklik profili
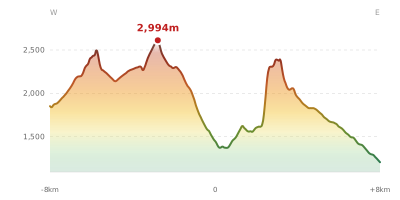
The east–west elevation profile of Pico da Neblina (2994m) shows the terrain cross-section through the summit at 2,994m. The color gradient transitions from green (valley floor) to white (summit zone), with the red summit marker indicating the peak.
Frequently Asked Questions
The contour map uses a hypsometric color scale where green represents lower elevations, yellow and orange indicate mid-range altitudes, and white marks the highest zones near the summit. Thicker contour lines (index contours) are drawn at wider intervals to help you quickly estimate elevation.
The contour map of Pico da Neblina (2994m) uses a 50m contour interval. This means each line represents a 50m change in elevation. Closely spaced contours indicate steeper terrain, while widely spaced contours show gentler slopes.
The elevation profile is a cross-section through Pico da Neblina (2994m) from west to east, passing through the summit at 2,994m. It reveals the mountain's shape, steepness, and relative height compared to the surrounding terrain. The horizontal axis shows distance in kilometers from the peak.
Pico da Neblina (2994m) was formed by tectonic folding, which compressed rock layers into long, parallel ridges. The contour map shows elongated lines that follow the axis of the fold, rather than circular patterns.